

The Butterfly Effect: BOJ Rate Hikes and a Vertical Move in Silver Prices
I. First, set out the objective facts
Event 1: Japanese government bonds are being sold aggressively.
BOJ Governor Kazuo Ueda has recently stated that the December meeting will discuss the pros and cons of further rate hikes—so far the strongest signal yet pointing to additional tightening.
The market reaction has been swift:
Japan’s 2-year JGB yield broke above 1% for the first time.
The 10-year JGB yield briefly rose to 1.8%–1.87%, the highest level since 2008.
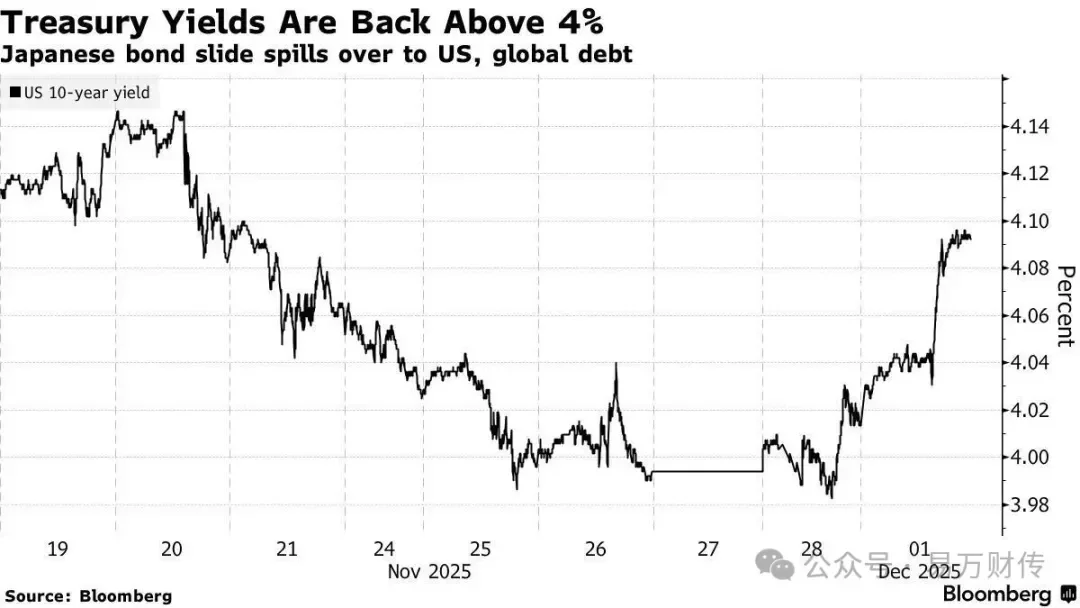
Global rates moved in sympathy. The broader global bond complex sold off, and the U.S. 10-year Treasury yield climbed back above 4%. Multiple media outlets described the move as a “global bond selloff.”
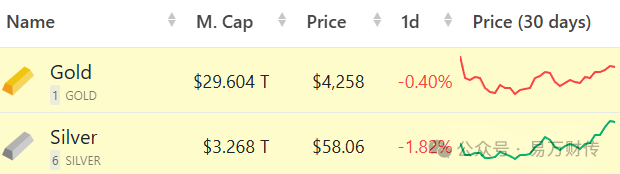
Event 2: Silver has printed new all-time highs.
Since the start of 2025, silver prices have roughly doubled, recently trading around $57–$59/oz, marking record highs. Over the same period, gold is up around 60%.
Mainstream explanations for the silver rally include:
a persistent supply deficit,
strong industrial demand, and
positioning for future Fed rate cuts.
At first glance, these two developments—one centered in Tokyo’s sovereign bond market, the other in global precious metals—appear unrelated. But capital is connected. The linkage can be summarized in two steps:
JGB selling reshapes global rates and risk appetite;
Within precious metals, silver’s market structure amplifies the impulse.
II. How does JGB selling “push” capital toward gold and silver?
Start with the macro transmission mechanism.
Japan’s exit from “ultra-loose” policy is a symbolic regime shift.
Japan has long been the last major central bank maintaining a zero-rate framework and yield curve control. Now, with the 2-year and 10-year JGB yields being “pushed” to post-2008 highs, markets are repricing Japan—and by extension, global rates.
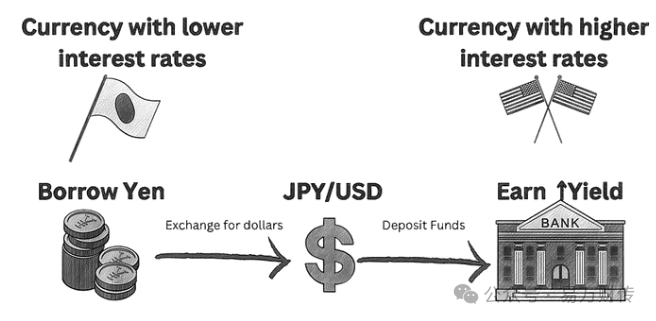
Carry trades begin to de-lever: the yen carry trade unwinds.
For over a decade, a common strategy has been:
Borrow in low-yielding yen → convert into higher-yielding currencies (e.g., USD) → buy global bonds and equities.
As Japanese rate expectations rise and the yen strengthens, the cost and risk of this trade increase. Some positions are forced to unwind—selling overseas assets and closing FX-funded leverage, with capital effectively repatriating back toward Japan. A number of research notes and media reports have attributed part of the recent cross-asset volatility to a large-scale retrenchment in yen carry.
In this shock, bonds behave more like risk assets.
JGBs, U.S. Treasuries, and European sovereigns sold off together. With long-end yields rising, mark-to-market losses widen for duration holders.
Against a backdrop of high rates + high debt, markets begin to demand higher sovereign risk premia—reflected in higher yields across maturities.
Some capital rotates from “bonds” into “hard assets” and “alternative money.”
Meanwhile, the market has been pricing a relatively strong probability that the Fed will continue cutting over the next 1–2 years and that real rates may decline—one of the core macro tailwinds behind this year’s gold and silver rally:
Lower real rates → lower opportunity cost of holding non-yielding precious metals.
Layer on sticky inflation dynamics and fiscal deficits, and precious metals gain appeal as assets perceived to sit outside the fiat system.
In short:
JGB selling + yen carry de-leveraging → pressure on global bond prices and higher long-end yields → some investors increasingly treat sovereign duration as a risk asset and rotate toward precious metals and other hard assets.
III. Once capital enters precious metals, why does silver outperform gold?
This is the second step: internal dispersion within precious metals.
1) Market size: the same inflow has a larger price impact in silver
Gold is a far deeper market, supported by central banks, sovereign institutions, pensions, and other long-duration allocators. Liquidity is structurally stronger.
Silver is materially smaller. It also lacks gold’s depth of institutional lending/market-making, and many analysts highlight that silver tends to experience larger moves when liquidity tightens.
This implies that when capital rotates into precious metals—from bonds or via macro reallocation—gold often reflects a steadier uptrend, while silver can translate the same impulse into a more violent, one-way move.
2) Mixed character: “monetary + industrial” demand
Gold is primarily a monetary/hedging asset with limited industrial demand.
Silver combines precious-metal characteristics with significant industrial exposure, widely used in solar PV, EVs, and electronics. Many reports note that global silver has run a multi-year supply deficit, which may persist into 2025—suggesting both industrial consumption and investment demand are drawing down available supply.

In that context, macro hedging demand (real rates/inflation) and structural industrial demand (energy transition/electronics) are stacked in silver, creating higher convexity than gold.
3) Gold–silver ratio mean reversion
Before this year’s move, gold had outpaced silver for a period. The gold–silver ratio at times reached 80–90, well above long-run averages commonly cited around 60–70. Many precious-metals research shops described silver as “cheap” relative to gold at those levels.
The recent silver surge compressed the ratio back into the 70s. Some institutions have framed the move as “gold–silver ratio reversion + silver catch-up.”
So when JGB-driven macro stress triggers broad precious-metals buying, many systematic and hedge fund strategies also see a relative-value signal—silver screens cheaper than gold—and may express the view through higher-beta silver exposure, further amplifying silver’s outperformance.
4) Market structure and the potential for short-squeeze dynamics
Silver futures liquidity and participant structure make it more prone than gold to forced short covering. Commercial hedgers and some market-making participants often carry short hedges in silver.
When price breaks key resistance under a macro tailwind plus catch-up logic, shorts may be forced to buy back to manage risk. A short squeeze can materially magnify upside in the near term. Media descriptions of this move have repeatedly referenced speculative inflows and squeeze-prone positioning.
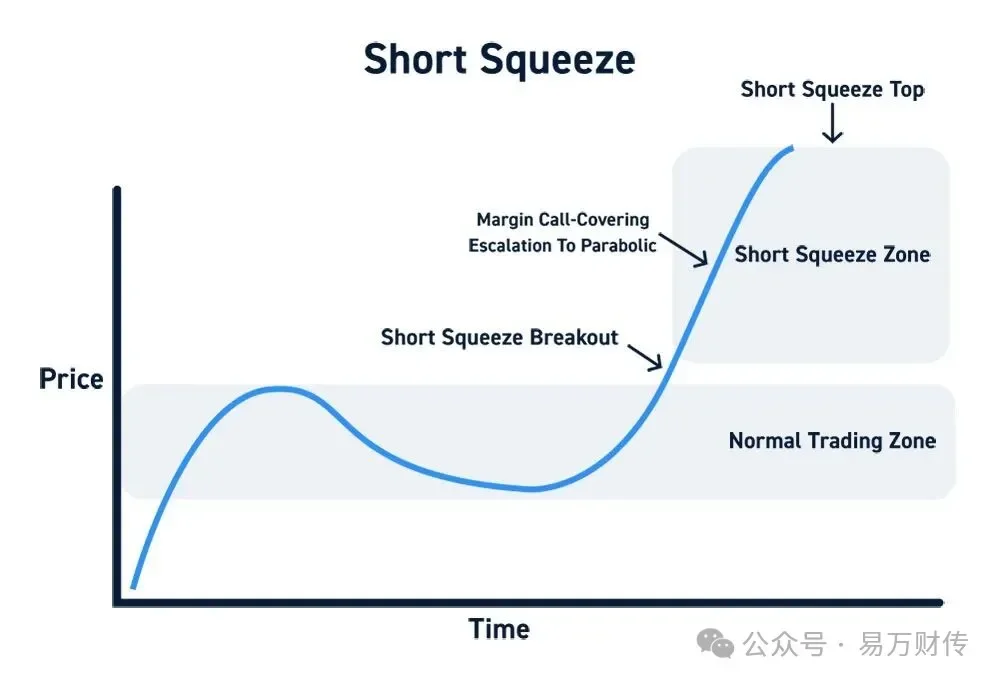
Gold’s depth is greater and short positioning is more diffuse, so comparable squeeze intensity is harder to sustain—hence gold tends to look “smoother,” while silver looks “sharper.”
IV. Putting the chain together: not “direct causality,” but a two-stage amplification
A more coherent framing is:
JGB selling is a key catalyst in a broader global repricing of rates and risk assets.
It raises expectations that the world may remain in a higher-rate regime for longer, while also accelerating yen carry de-leveraging—lifting volatility and the risk premium embedded in sovereign duration.
As that unfolds, some capital exits long-duration bonds (and certain risk assets) and rotates into precious metals and other hard assets. This impulse is reinforced by the market’s pricing of continued Fed easing and lower real rates—an environment that is broadly constructive for precious metals.
Within precious metals, silver—due to its smaller market size, dual monetary/industrial demand, prior relative undervaluation, and squeeze-prone market structure—becomes the highest-beta receiver of the flow.
So the more rigorous statement is not “JGB selling directly caused silver to surge,” but:
JGB selling → global repricing of rates and risk → rotation from bonds into precious metals → within precious metals, silver’s structure and relative valuation act as an amplifier, producing gains that materially exceed gold.